Fig. 3.
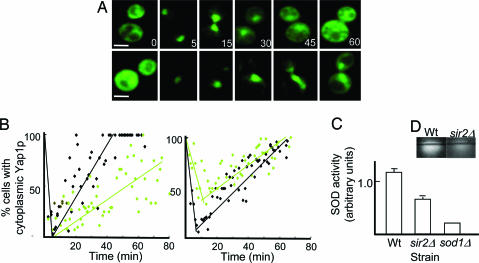
Daughter cells display a Sir2p-dependent superior capacity to respond to external oxidants. (A) Representative pictures of Yap1p–GFP localization in daughter cells of the WT (top row) and sir2Δ mutant (bottom row) upon exposure to tBOOH. The numbers denote 0, 5, 15, 30, 45, and 60 min after addition of the oxidant. (B) Recovery from tBOOH stress, measured as relocalization of Yap1p to the cytoplasm, in WT (black diamonds) and the sir2Δ (green diamonds) mother (Right) and daughter (Left) cells. (C and D) SOD activity in WT, sir2Δ, and sod1Δ (for a comparison) daughter cells upon completion of cytokinesis (C); corresponding images of in-gel SOD activity (D). Error bars correspond to the SE. (Scale bar, 5 μm.)

