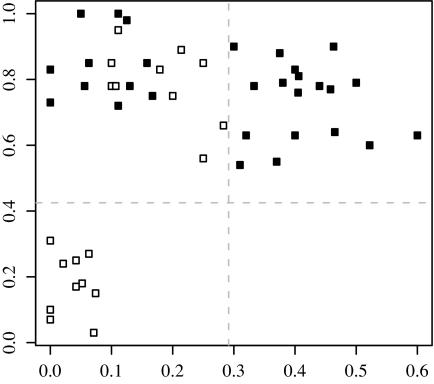
Fig. 1.
Linguistic tone versus the population frequency of the adaptive haplogroups of ASPM and Microcephalin. The horizontal axis represents the frequency of ASPM-D, whereas the vertical axis represents the frequency of MCPH-D. Filled squares represent nontonal languages and open squares tonal languages. Gray dashed lines correspond to 0.292 ASPM-D and 0.425 MCPH-D. See last paragraph of Results for details.

