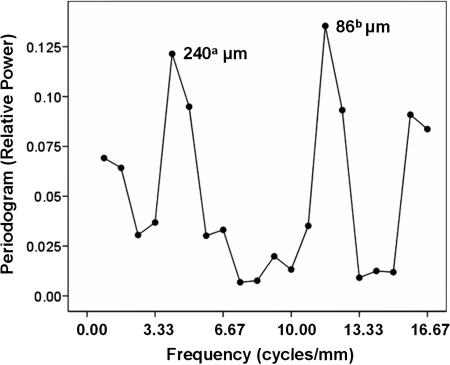
Fig. 4.
Normalized periodogram (13) of detrended observed data using a circular grid of 30-μm annulus. The period of statistically significant points is displayed next to the points. The levels of statistical significance of the labeled points were as follows. a, P = 0.032; b, P = 0.017.

