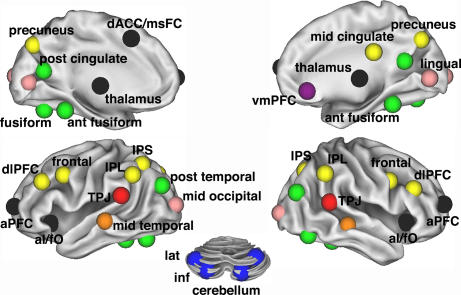
Fig. 3.
Task-control graph components (r ≥ 0.2) on the brain. Eight separate components that constitute task-control graph (r ≥ 0.2) displayed on inflated surface rendering of the brain. Nodes are color-coded by components in Fig. 2A. Interregional correlations were significant at P < 1 × 10⁻⁹ (two-tailed; Bonferroni corrected; t test).

