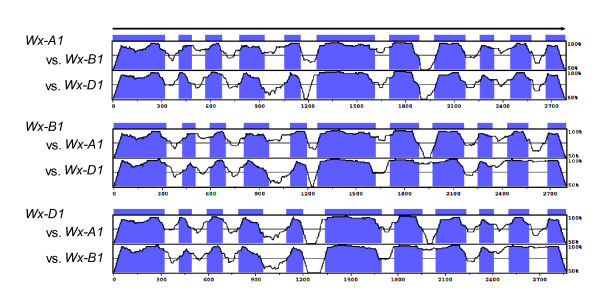
Figure 1.

Comparison of homoeologous Wx gene sequences of wheat. Comparison of the genomic sequences of three homoeologous Wx genes [27] using mVISTA [51, 52]. The horizontal axis shows the base number from the start codon for the respective reference gene, while the vertical axis shows the degree of homology. Blue and white regions indicate exon and intron regions, respectively.
