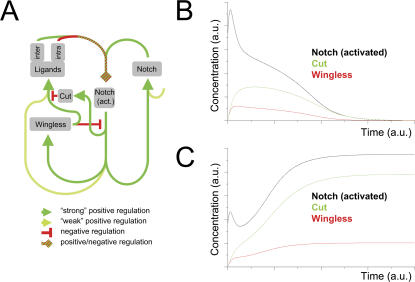
Figure 2. In silico testing of the gene regulatory network: refractoriness to Wg in boundary cells renders stability to the DV regulatory network.
(A) Regulatory network for the formation of the DV boundary. Positive and negative regulations are coded with green and red colors, respectively. Color intensity in positive regulations indicates, qualitatively, the strength of expression levels (the lighter the weaker). The green-red dashed line that ends with a rhombic arrowhead indicates that receptor-ligand dynamics may lead to either positive or negative regulation: Notch-ligand binding in the same cell (intra) or in adjacent neighboring cells (inter) lead, respectively, to titration (sequestering effects) or activation of Notch. Activated Notch induces ligand and receptor expression at low levels, thus closing a positive feedback loop that maintains each other's expression at early stages of wing development. Note that Notch has an additional autonomous off-network regulation. Increased Notch activity induces expression of Wg and Cut. The latter represses Ser and Dl. (B) Evolution of Wg (red) expression levels, Notch activated (black), and Cut (green) in boundary cells as a function of time. The boundary is initially established but cannot be maintained (see text). (C) Evolution of Wg (red) expression, Notch activated (black), and Cut (green) levels in boundary cells as a function of time in a scenario in which refractoriness to Wg has been taken into account in boundary cells (see text). Note stable activation of Notch and expression of Wg and Cut in this case, when compared to (B).

