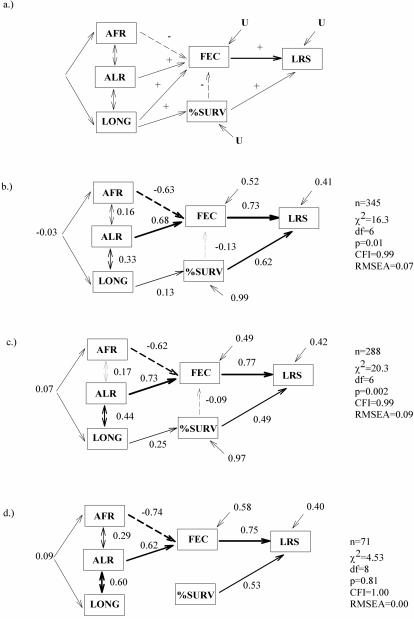
Figure 2. Initial theoretical path model (a) and the final model for the Rich (b), the Middle-class (c), and the Poor (d) wealth class.
These models describe linear selection gradients (i.e., standardized partial regression coefficients) of age at first reproduction (AFR), age at last reproduction (ALR), longevity (LONG), fecundity (FEC), and offspring survival (%SURV) on lifetime reproductive success (LRS) of historical Finnish mothers. Single headed arrows represent assumed causal relationships and double-headed arrows non-causal correlation between two variables. Positive selection gradients are given in solid lines and negative selection gradients in dashed line. Thickness of the arrows represents the magnitude of that association. Statistically non-significant selection gradients are omitted from the final path models. U denotes to the error variance in dependent variables not explained by antecedent variables in the model.

