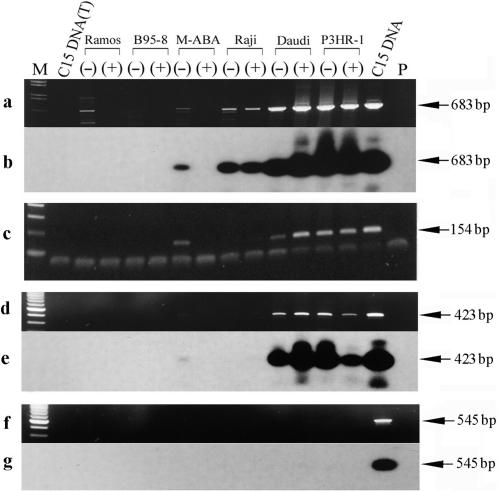
Figure 6.
Mapping of the LF3 promoters P3 and P4 by RT-PCR. cDNAs were synthesized by reverse transcription of total RNAs from cell lines, as indicated, using a gene-specific primer Ia-1T. Primers used for PCR amplifications to detect RNA species ‘upstream’ of the P2 promoter are indicated (below) and their locations on the EBV genome map given in ‘Materials and Methods’. Panel a shows ethidium bromide stained gel results using primers Ia-2T and Ia-6B in PCR amplifications to detect a possible third promoter, P3, and panel b the same gel hybridized with 32P-labelled Ia-3T. Panel c confirms the data in a using a different set of primers, a combination of Ia-6T and Ia-8B. Notably, this P3 promoter was not identified in the case of BHLF1 (see ‘Results’ section). To detect a possible fourth promoter, P4, for the LF3 transcript, the same cDNA samples were used in further experiments given in panels d–g. In panel d, primers Ia-6T and Ia-9B were used and the products probed with 32P-labelled Ia-8B (panel e). In panel f, primers Ia-6T and Ia-11B were used, with probe 32P-labelled Ia-8B (panel g). Notably, whereas products were observed in panels d and e, none were observed in f and g. M-tracks contain size markers, P-tracks, primers only, and (T)-tracks, DNase I-treated DNA from the cells.

