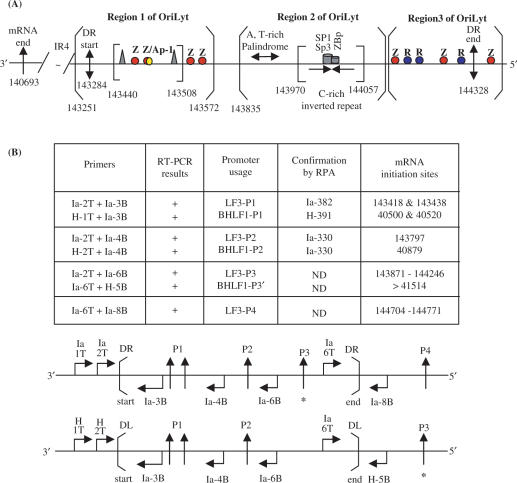
Figure 7.
Summary of transcriptional responsive elements (TREs) and promoters identified for BHLF1 and LF3, within oriLyt, as given here for LF3 and elsewhere for BHLF1 (21). (A) The IR4 repeat region and the 3′-mRNA end (single arrow) are indicated. The duplicated sequence (DS) regions of EBV DNA contain potential structural elements that divide it into three distinct regions, as noted (open brackets). Region 1 contains the DR start (in LF3 at position 143 284; double-headed arrow), as well as the LF3 mRNA start site from the inducible promoter pair, P1 (not shown), a number of zta (Z or EB1)-responsive elements (in red) and an Ap-1 binding sequence (yellow). The core OriLyt sequence in region 1 is indicated (closed brackets) and contains ‘TATA’ and ‘CAAT’ boxes (triangles) and TREs, as shown. The P2 non-inducible promoter maps to position 143 797, between regions 1 and 2. Region 2 contains a DNA sequence that permits formation of three short A,T-rich hairpin loops in BHLF1 (between positions 40 974 and 41 044) and in LF3 (between 143 893 and 143 964), and a putative ‘hinge’ (H) G,C-rich region with triple and single-stranded components, in BHLF1 (between 41 077 and 41 140) and in LF3 (predicted, between 143 995 and 144 023), as well as SP1/SP3 and ZBp TRE elements (21), as noted. Region 3, further ‘upstream’, contains the 5′-end of DR (in LF3 at position 144 328; double-headed arrow) as well as both Z (red) and R (rta or EB2, blue) responsive elements, interspersed. These may compete with each other, or alternatively, act cooperatively in transcription events. Immediately outside the DR region is a further Z responsive element. Sp1, Sp3 and ZBP are cellular transcription factors (21). (B) Summary of promoter mapping data. To determine the transcriptional expression from different promoters, each transcript was first detected by RT-PCR (shown in part in Figures 4 and 6), then fine-mapped and confirmed by RNase protection assays (Figures 2, 3 and 5). RT-PCR data are summarized in Tables 1 and 2. Another promoter, designated P3′, for BHLF1 and P3 for LF3 transcripts, was identified and partly, but not precisely, mapped in these studies. For BHLF1, it lay outside DL, whereas for LF3 it was within DR. A fourth promoter, P4, was found for the LF3 transcript and localized by RT-PCR, outside DR, as shown. It may functionally correspond to P3′ for BHLF1, but this is not confirmed. The laboratory data are compiled here in tabular and linear forms and the precise, or approximate (*), locations of the various promoter sites within or outside DS, are identified for LF3 (P1–P4) and for BHLF1 (P1–P3′). PCR primers used in each case (see ‘Materials and Methods’) are given for each gene, and their locations noted.

