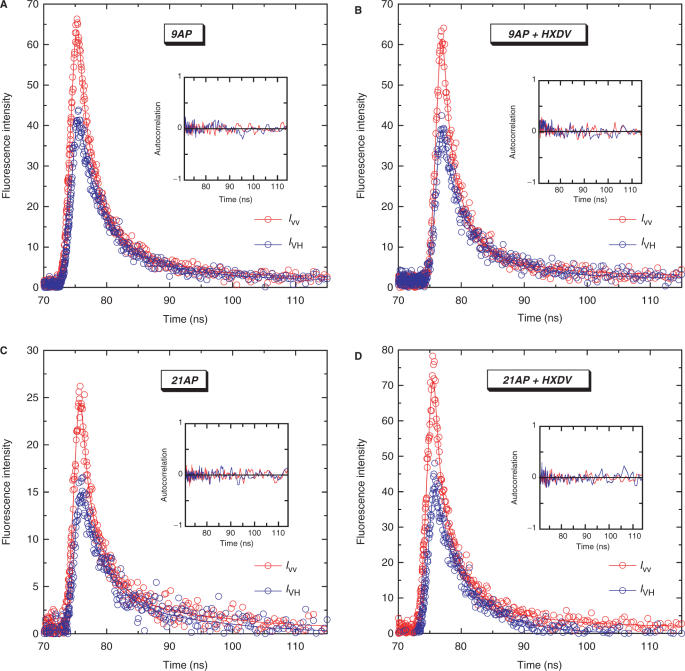
Figure 9.
Polarized fluorescence decay profiles at 25°C for 9AP (A), 21AP (C) and their complexes with HXDV (B and D, respectively). The decay profile with the emission polarizer oriented parallel to the excitation polarization (IVV) is depicted in red, while the decay profile with the emission polarizer oriented perpendicular to the excitation polarization (IVH) is depicted in blue. In each panel, the hollow circles represent the experimental data points, while the solid lines reflect the nonlinear least squares fits of the data with Equation (2). The inset in each panel shows the autocorrelation functions of the weighted residuals for the fits of the corresponding decay profiles. The solution conditions were as described in the legend to Figure 3.

