Figure 6.
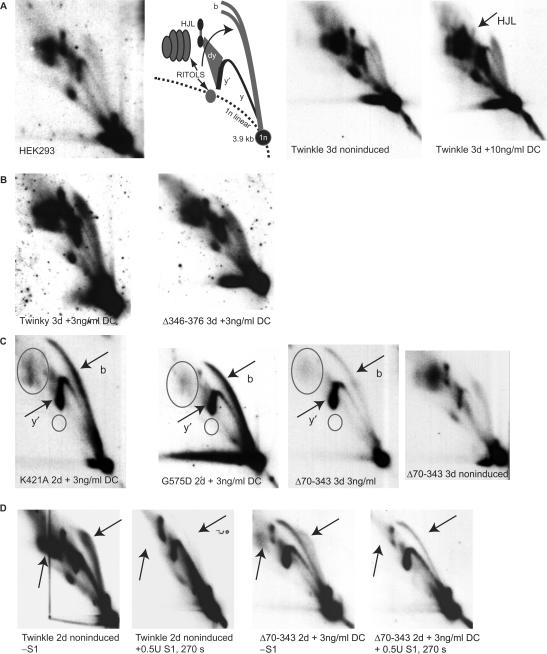
Some Twinkle mutants cause replication stalling. 2DNAGE samples for all panels consisted of purified mtDNA digested with HincII and probed with a radiolabeled cytochrome b gene fragment (nt 14 846–15 357). The detected fragment includes the non-coding region of mtDNA also including the cytochrome b, ND6, part of the ND5 gene and intervening tRNA genes (nt 13 636–1006). (A) The first two panels on the left show the RIs of HEK293 cells and the interpretation based primarily on earlier 2DNAGE analysis of mtDNA RIs (7,9). Abbreviations: 1n, 3.9 kb non-replicating HincII fragment. (b) bubble arcs. MtDNA bubble arcs are usually very sensitive to RNase H due to the presence of patches of RNA–DNA especially on the lagging strand; these therefore also fall in the category of RITOLS as do various other RIs. Here, y and y′ indicate ascending and descending parts of the y arc and (dy) indicates double-Y structures. These will eventually form resolution intermediates resembling Holliday junctions (HJL-Holliday junction like molecules). The two panels on the right show a comparison of RIs of non-induced and fully induced cells expressing Twinkle wt. The only notable difference in this case is a reproducible reduction in one of the HJL RIs as indicated. (B) A normal pattern of RIs similar to non-expressing cells was observed in cells expressing Twinky or the ▵Linker variant. (C) K421A, G575D and ▵70–343 show similar patterns of replication stalling, with increased bubble (b) and descending Y-arc (y′) intensities, a sharpening and lengthening of the bubble arc and loss of RITOLS (ovals). The right-most panel shows the same exposure 2D gel pattern of the non-induced ▵70–343 line showing the typical HincII fragment pattern, including abundant RITOLS. (D) A limited S1 digestion illustrates that stalled RIs observed in panel C are S1 insensitive (right two panels). The effectiveness of the S1 treatment is illustrated by the left two panels, showing the effect on Twinkle non-induced cells. Similar to the S1 treatment RNase H treatment shows that the stalling RIs observed with Twinkle mutants are largely insensitive to this enzyme (Supplementary Figure 2), showing that the observed stalled RIs in panel C are essentially dsDNA. Although the intensities in subfigures A–D cannot be directly compared due to differences in exposure time, each panel contains appropriate controls of similar exposure. For example, the exposures of the left two panels in C have been chosen to be similar in comparison to the right-most panels to properly illustrate the severity of the stalling phenotype.

