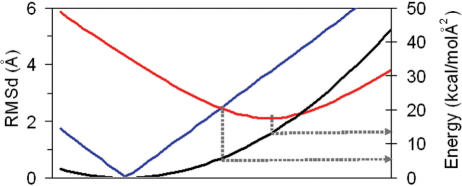
Figure 2.
Representation of the energy (black), and RMSd with respect to A (in red) and B (in blue), when a relaxed DNA structure is perturbed along its first essential mode. RMSds were computed with reference to the MD-averaged A and B-conformations. Blue line is not smooth because perturbation along first essential mode is made using MD-averaged B-conformation.

