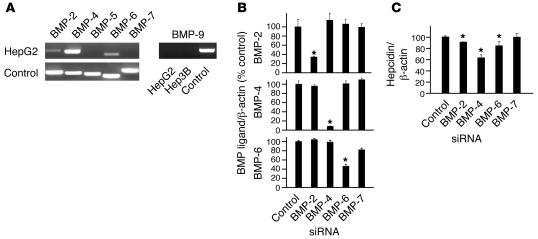
Figure 4. siRNA inhibition of endogenous BMP ligands decreases basal hepcidin expression.
(A) Expression of endogenous BMP ligands in HepG2 cells as measured by RT-PCR. Purified plasmid cDNAs expressing BMP ligands were used as positive controls. (B and C) HepG2 cells were transfected with BMP ligand siRNAs or a control scrambled siRNA as indicated. Total RNA was analyzed for BMP ligand expression (B) or hepcidin expression (C) relative to β-actin expression by real-time quantitative RT-PCR. Results are reported as the mean ± SD of the percent decrease in the ratio of hepcidin or BMP ligand to β-actin for cells treated with various BMP siRNAs compared with cells treated with control siRNA; n = 3–6 per group; *P < 0.05.

