
Table 2.
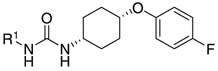
| Compound | IC50a(nM) | Inhibitionb(%) | R1 | Mp (°C) |
|---|---|---|---|---|
| 1{1} | 0.5 ± 0.1 | 86 ± 9 | Adamantyl | 242–245 |
| 1{4} | 0.5 ± 0.1 | 87 ± 8 | c-Hep | 158–167 |
| 1{12} | 1.0 ± 0.1 | 76 ± 7 | 4-I–Ph– | 198–201 |
| 1{13} | 0.7 ± 0.1 | 81 ± 8 | 4-Cl–Ph | 177–182 |
| 1{14} | 0.6 ± 0.1 | 80 ± 6 | 4-Br–Ph | 192–194 |
| 1{15} | 0.9 ± 0.1 | 84 ± 7 | 4-OCF3–Ph | 157–158 |
| 1{16} | 1.2 ± 0.2 | 82 ± 5 | 4-CF3–Ph | 171–174 |
| 1{34} | 100 ± 5 | 2 ± 3 | 2-OCF3–Ph | 158–160 |
| 1{38} | 1200 ± 100 | 4 ± 3 | 2,6-Di-Me–Ph | 196–199 |
| 1{39} | 940 ± 60 | 1 ± 1 | 2,6-Di-Cl–Ph | 181–187 |
| 1{40} | 50500 ± 500 | 5 ± 3 | 2,6-Di-i-Pr–Ph | 218–222 |
| 7 | 2.9 ± 0.2 | 62 ± 13 | 4-CO2Me–Ph | 162–163 |
| 8 | 220 ± 5 | nd | 4-CO2H–Ph | 269–285 |
| 9 | 2.0 ± 0.2 | 72 ± 6 | 3-CO2Me–Ph | 116–123 |
| 10 | 590 ± 60 | nd | 3-CO2H–Ph | 240–254 |
nd denotes not determined.
a
Determined via a kinetic fluorescent assay, results are means ± SD of three separate experiments.
b
Determined via an end-point fluorescent assay, results are means ± SD of three separate experiments.