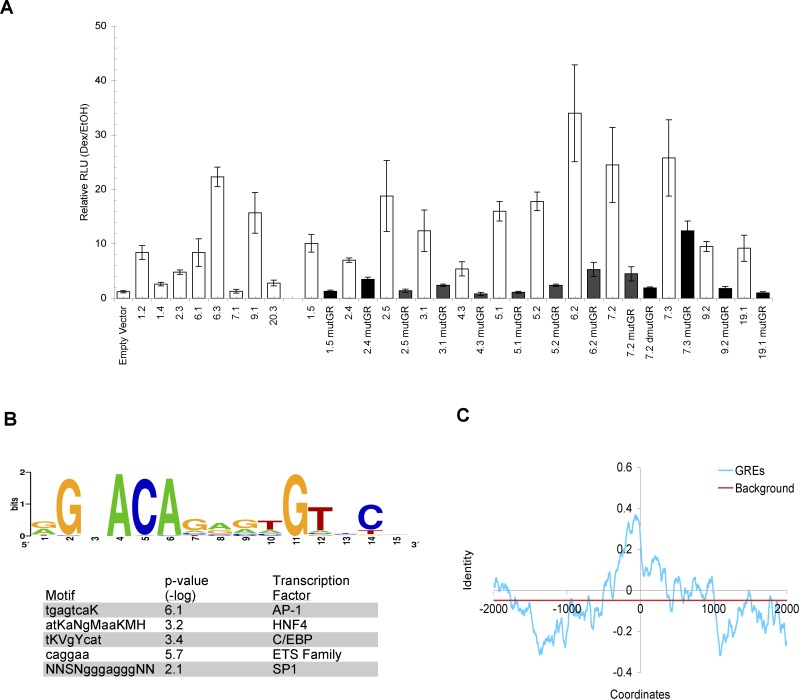
Figure 3. Native Chromosomal GREs Are Composite Elements.
(A) GBRs confer glucocorticoid responsiveness. A549 cells transfected with luciferase reporter genes linked to 500 bp GBRs were treated with EtOH or 100 nM dex for 5–7 h, harvested, and measured for luciferase activity. Fold dex inductions are plotted for wildtype (white) reporters and mutant (black) reporters with singly (mutGR) or doubly mutated (dmutGR) GR binding sites; standard errors of mean over at least three independent experiments are shown. The 13 mutated GR binding sites were randomly chosen. The GREs that harbor these GR binding sites represent a range of enriched GBRs, ranging from ~6- to 40-fold dex-induced GR occupancy as assessed by ChIP-qPCR (unpublished data).
(B) Identification of enriched motifs within GBRs is shown. Top panel: Sequence logo, generated using WebLogo [58], represents all the compiled sequences resembling GR binding sites identified through computational analysis. Bottom panel shows other enriched motifs (displayed in IUPAC symbols) found in the GRE sequences. Motifs resembling AP-1, HNF4, and C/EBP binding sites were identified using BioProspector whereas motifs similar to ETS and SP1 binding sites were found with MobyDick. The p-values of the enriched motifs represent the random probability of these motifs occurring within the GREs.
(C) Conservation analysis of GREs. The identity of the human and mouse sequences was calculated as number of bp matches minus the number of bp deletions or insertions, divided by a 50-bp window. Shown are the average identities for each window across 50 GREs. The background level was calculated as the average of all conservation scores across the 4-kb region. The abscissa shows bp positions with 0 defined as the center of core GR binding sites for GREs.

