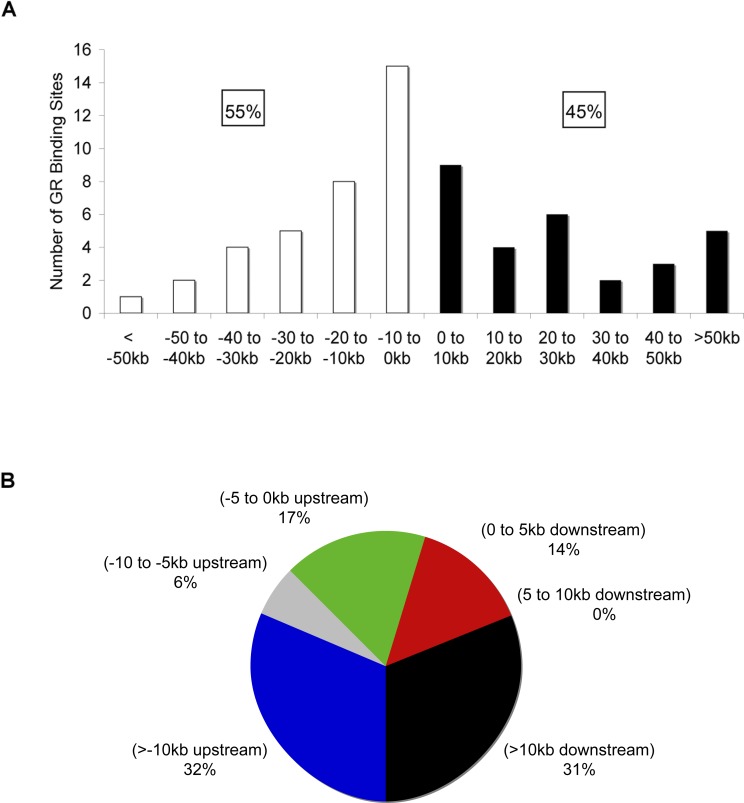
Figure 4. Location and Position of GREs.
(A) Locations of GREs relative to the TSS of target genes. The number of GREs resident in 10-kb increments relative to the TSS of the target gene are plotted. White bars and black bars represent GREs upstream and downstream of the TSS, respectively.
(B) Distribution of GREs relative to target gene transcription start site is shown. The chart presents percentage of GREs at various positions upstream and downstream of target genes. Note that only 64 of the 73 GREs detected in A549 cells were included in these analyses; the remaining nine GREs did not associate with a dex-responsive gene in these cells. The GREs were assigned to the nearest gene regulated by GR in A549 cells from the final list of genes that were included or impinged upon by the ChIP-chip arrays. Coordinates of TSSs were obtained from UCSC Genome Browser based on RefSeq. Similar results were obtained when we used TSS coordinates that were experimentally determined (DataBase of Transcriptional Start Sites) through 5′ end cloning (unpublished data) [59]. The TSS of the longest transcript was used for genes that have multiple alternative TSSs. Similar results were obtained if the GREs were assigned the closest TSS of the associated dex-responsive gene: 38% of GREs were located downstream from TSS; 58% of GREs were positioned farther than 10 kb from the assigned TSSs.

