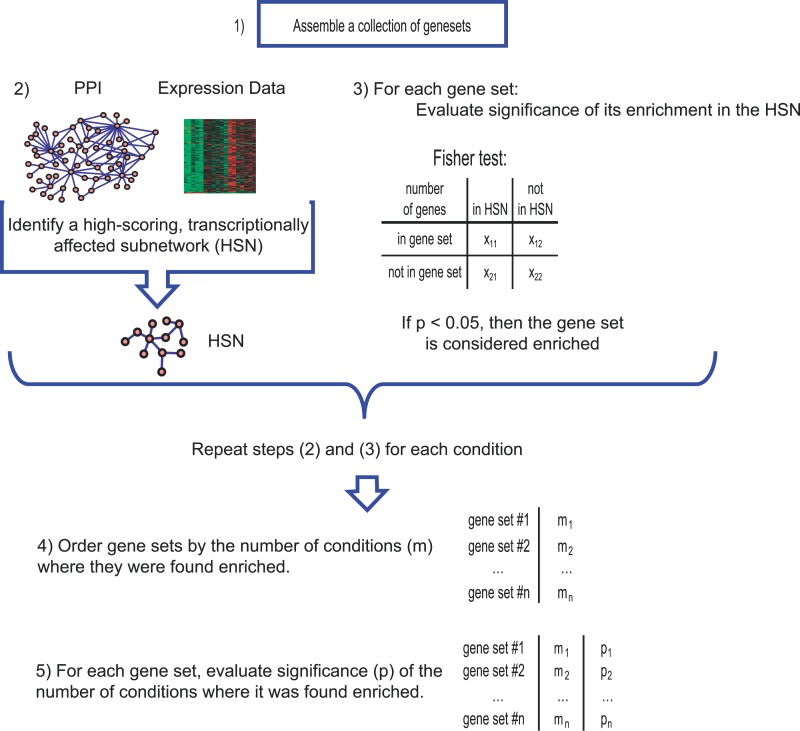
Figure 1. Overview of GNEA.
(1) A collection of gene sets associated with biological processes was assembled. (2) The relative mRNA expression of every gene in each insulin resistance or diabetes condition was mapped to the associated protein in a global network of protein–protein interactions and a significantly transcriptionally affected subnetwork, HSN, was identified. (3) Each gene set was tested for overrepresentation in each HSN based on a Fisher's exact test. A gene set was considered enriched in the condition if the Fisher's p-value fell below 0.05. (4) Gene sets were ordered based on the number of conditions in which they were enriched. (5) For each gene set, the number of conditions in which it was enriched was assigned a p-value based on comparison against a background distribution.

