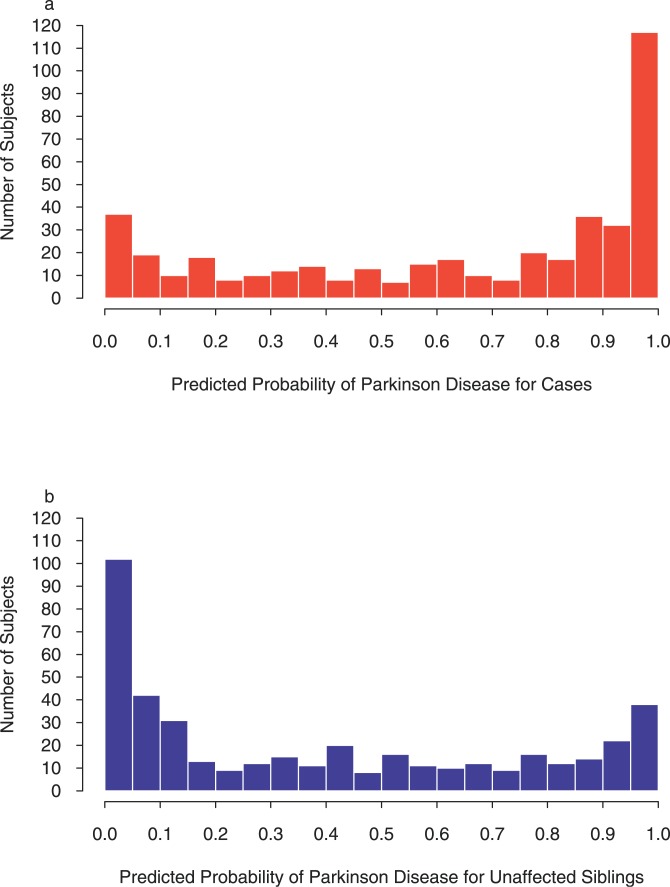
Figure 1. Goodness-of-Fit of Final Model Using Axon Guidance Genes to Predict Susceptibility to PD.
Data presented are within our primary whole-genome association dataset [11]. Histogram of predicted probabilities of PD in cases (A) and histogram of predicted probabilities of PD in unaffected siblings (B) are presented. A perfect fit would have all predicted probabilities for cases equal to one and all predicted probabilities for unaffected siblings equal to zero. A model with no explanatory value would have histograms that were indistinguishable from each other. Conditional logistic regression analyses were used to generate the probabilities, and hence the data do not fit a single exponential curve (one end close to zero).

