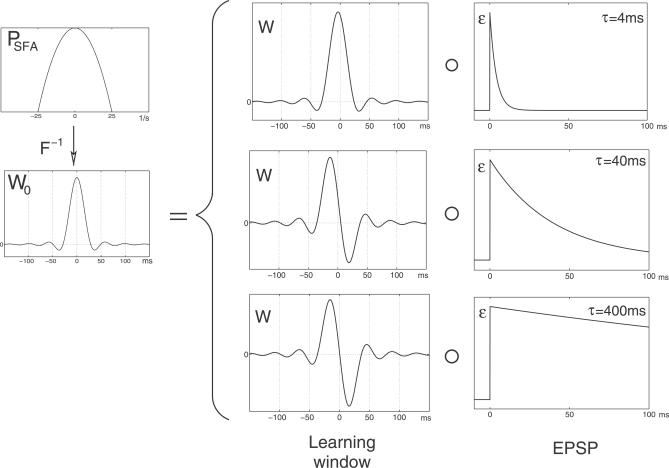
Figure 3. Relation between the EPSP and the Learning Window.
The power spectrum is the Fourier transform of the effective learning window W
0, which in turn is the convolution of the learning window W and the EPSP ɛ. The figure shows the learning windows required for SFA for three different EPSP durations (τ = 4, 40, 400 ms). The maximal input frequency ν
max was 1 / (40 ms) in all plots.

