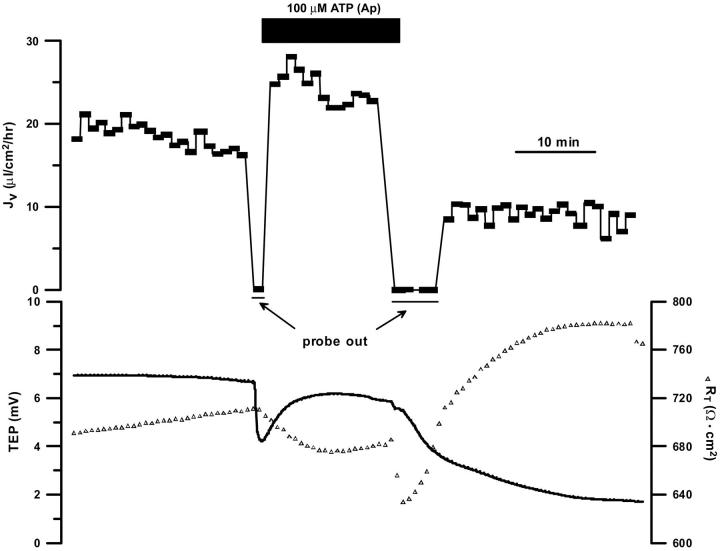
FIGURE 12.
ATP-induced changes in TEP, RT and fluid transport. Top: JV is plotted as a function of time and net fluid absorption indicated by positive values. No JV measurements were made during the solution composition changes (period marked by “probe out”). Bottom: TEP and RT plotted as a function of time in control Ringer and in the presence of 100 μM ATP. ATP increased JV by 6 μL · cm−2 per hour, decreased RT by ≈30 Ω· cm2, and transiently decreased TEP by ≈3 mV.

