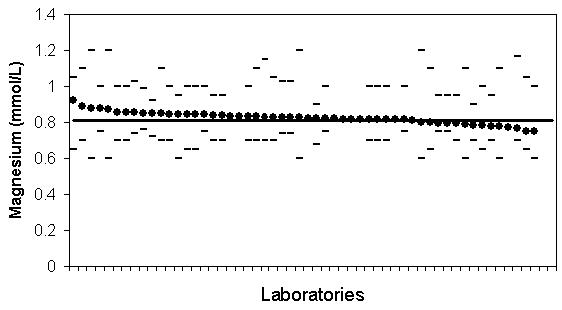
Figure 1.

IMEP-17 data for Australian and New Zealand participants for magnesium. Magnesium concentration of supplied sample, average of 10 measurements (filled circles); upper and lower reference limits (dashes), and the IMEP target value (unbroken line). The data is sorted in order of decreasing values for measured magnesium. Note there is no correlation between measured magnesium concentration and the stated reference limits.
