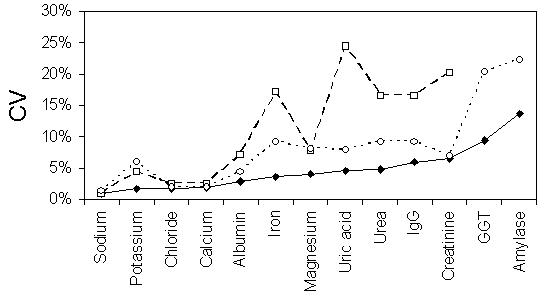
Figure 2.

IMEP-17 data for Australian and New Zealand participants. Plot of between-laboratory variation for analyte concentration (closed diamonds) and upper (open circles) and lower reference interval values (open squares). Variation expressed as the CV. Note no data is supplied for lower reference intervals for GGT and amylase due to the use of "less than" formats in some laboratories.
