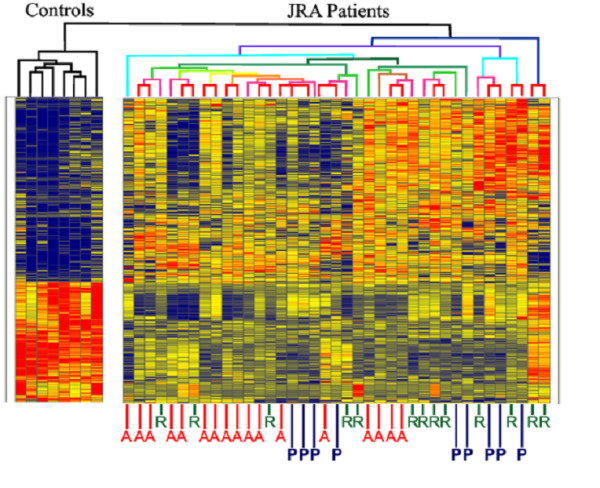
Figure 2.

Hierarchical cluster analysis of gene expression profiles in children with polyarticular, RF-negative JRA. Gene expression profiles are compared with those of healthy controls, shown on the left of the grid. Children with active disease ("A") scatter through the heat map with children with "responsive" ("R" = "inactive") disease and children who have shown a "partial" response to therapy ("P" = have met ACR30 criteria). From Jarvis et al, Arthritis Res Therapy 2006. The authors retain the copyright for this material.
