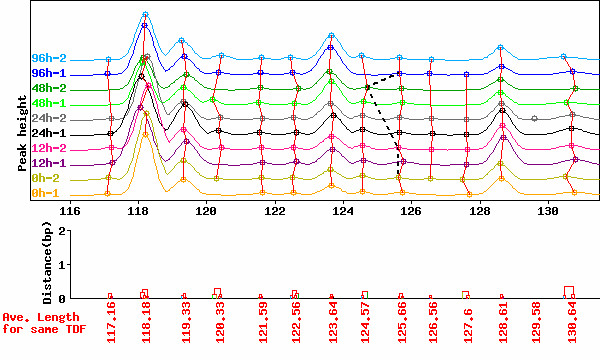
Figure 2.

Normalized peak fragment lengths in HiCEP electropherograms in Fig. 1. Note that individual TDFs are represented by tight clusters and all peaks in the cluster are of course correctly aligned. The alignment connected by black bold lines in Fig. 1a is represented by black dashed lines and sectioned when peak alignment is reapplied to the normalized electropherograms.
