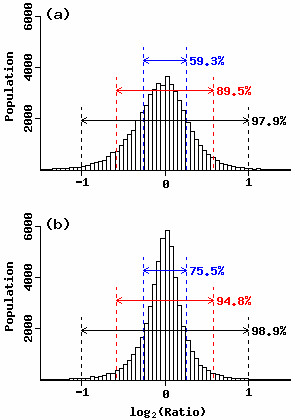
Figure 4.

Distribution of peak height ratios between replicate experiments. Ratios are calculated using peak heights when the normalizations are performed using (a) all the reported TDFs (a conventional method used in [12, 28]) and (b) a subset of the selected TDFs (GOGOTnormH). Dashed lines in blue, red, and black indicate 1.2-, 1.5-, and 2.0-fold differences in peak heights, respectively.
