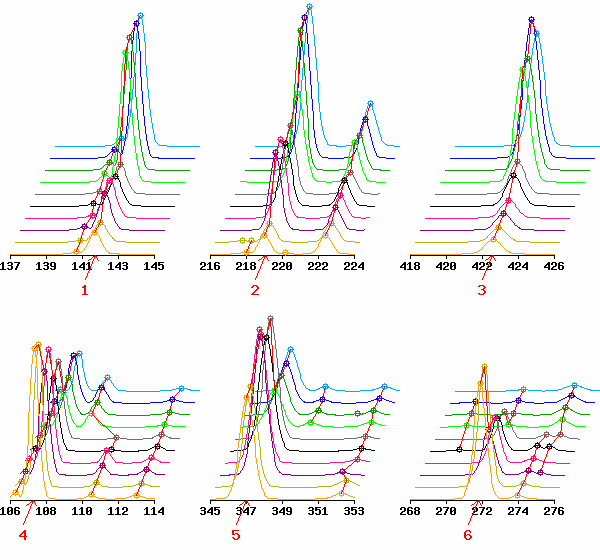
Figure 5.

Expression patterns of top six TDFs listed in Table 2. Local (8 bp of range) electropherograms including the top-ranked TDFs indicated by red arrows are shown. Numbers below arrows indicate the ranks of the TDFs. Each electropherogram is shown in common scaling.
