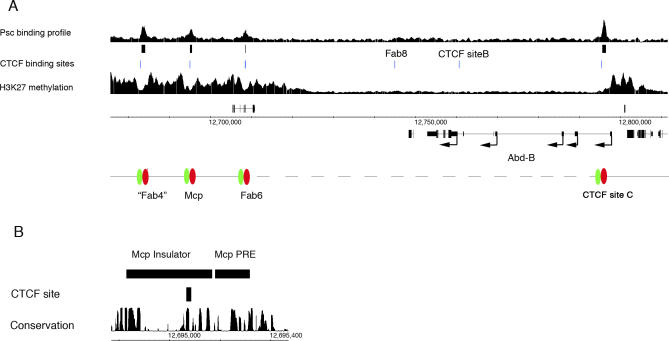
Figure 5. Genomic Context of CTCF Sites in the BX-C.
(A) Shown is a comparison between the locations of CTCF binding sites, Polycomb target sites, and histone H3 lysine 27 (H3K27) methylation from the data of Schwartz et al. [42]. For the Polycomb targets the Psc track is shown but the Pc and E(Z) binding profiles identify the same targets sites in this region. CTCF sites are closely related to Polycomb targets sites as illustrated by the schematic with CTCF sites in green and Polycomb sites in red.
(B) Detailed view of the Mcp region shows the relationship between the CTCF site, the mapped domains of the insulator, the PRE, and the PhastCons conservation track. The CTCF site sits within the mapped insulator and lies over a clear discrete conservation peak.

