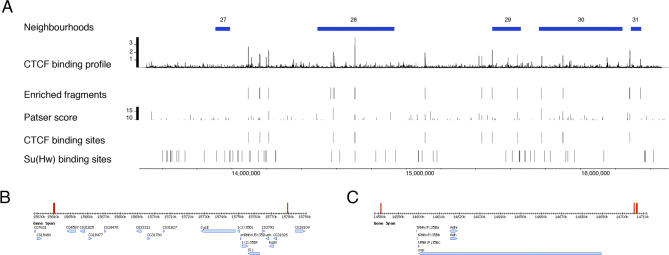
Figure 6. CTCF Sites across the 3-Mb Adh Region.
(A) CTCF binding profile shows the Mn (equivalent to log2ratio) for the array fragments. Enriched fragments row plots fragments with enrichment (mean > 0.45; p < 0.05). Patser score plots the scores for Patser hits with p < 10−12. CTCF binding sites depict Patser sites with p < 10−12, which are associated with significant enrichment (Mn > 0.45; p < 0.05). SuHw binding sites show the Patser p < 10−15 Su(Hw) binding sites from (B. Adryan, G. Woerfel, I. Birch-Machin, S. Gao, M. Quick, L. Meadows, S. Russell and R. White; unpublished data). There is no clear correlation between Su(Hw) sites and CTCF sites. Neighbourhoods row depicts the gene expression neighbourhoods of Spellman and Rubin [48]; the neighbourhood boundaries in some instances map close to CTCF sites, but the overall correspondence is not compelling.
(B and C) Selected regions show the arrangement of CTCF sites (marked by red bars) around the CycE gene and the osp locus.

