
FIGURE 6.
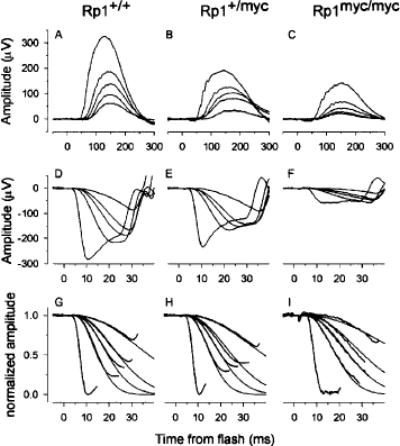
Electroretinograms of mice of the three genotypes at 4 to 5 weeks of age. (A–C)Scotopic b-waves obtained in response to a series of 510-nm flashes with luminances of 3.2 × 10⁻⁴, 9.2 × 10⁻⁴, 1.6 × 10⁻³, 3.4 × 10⁻³, and 1.8 × 10⁻²scot cd-s . m−2estimated to produce 0.16, 0.46, 0.79, 1.7, and 9.0 photoisomerizations/rod, respectively, in a normal mouse. Each trace is the average of nine individual records (the traces of the two eyes were also averaged during analysis). The saturating amplitude of the b-wave was extracted by fitting a hyperbolic saturation function to the intensity versus amplitude function.36(D–F)ERG a-waves, obtained in response to flashes having luminances of 0.74, 1.9, 4.0, 87.0, and 220 scot cd-s . m−2, estimated to produce 370, 960, 2,000, 4,000, and 110,000 photoisomerizations/rod, respectively in a wild-type mouse. The saturating amplitude of the a-wave was obtained directly from the response to the most intense flash. (G–I)The a-wave data of panels (D–F)are presented normalized by the saturating a-wave amplitude and fitted with a model of the activation phase of the phototransduction cascade to extract the amplification constant.37With flash intensities expressed in luminance units, the amplification parameters are KA2000, 1800, and 1000 seconds−2(scot cd-s. m−2)−1for the data of the Rp1+/+, Rp1+/myc, and Rp1myc/mycmice, respectively. For further details see Table 1.