
FIGURE 7.
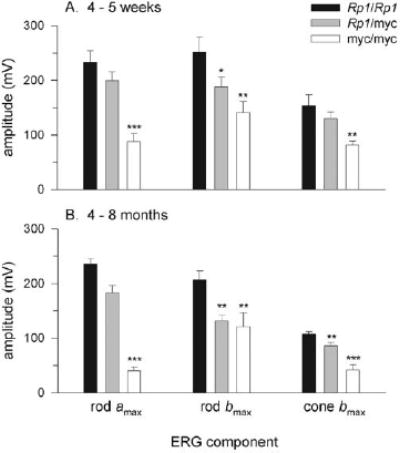
Saturating amplitudes of the principal components of the electroretinograms. Each panel presents the mean saturating amplitudes (±SEM) of the a-wave (rod amax), the scotopic b-wave (rod bmax),and the cone-driven b-wave (conebmax)obtained from populations of animals of the indicated genotypes of ages 4 to 5 weeks (A)and 4 to 8 months (B). Differences between the components of the wild-type (Rp1+/+) mice and mice of the other two genotypes that are statistically significant are indicated by *P< 0.05, **P< 0.01, and ***P< 0.001. See also Table 1.