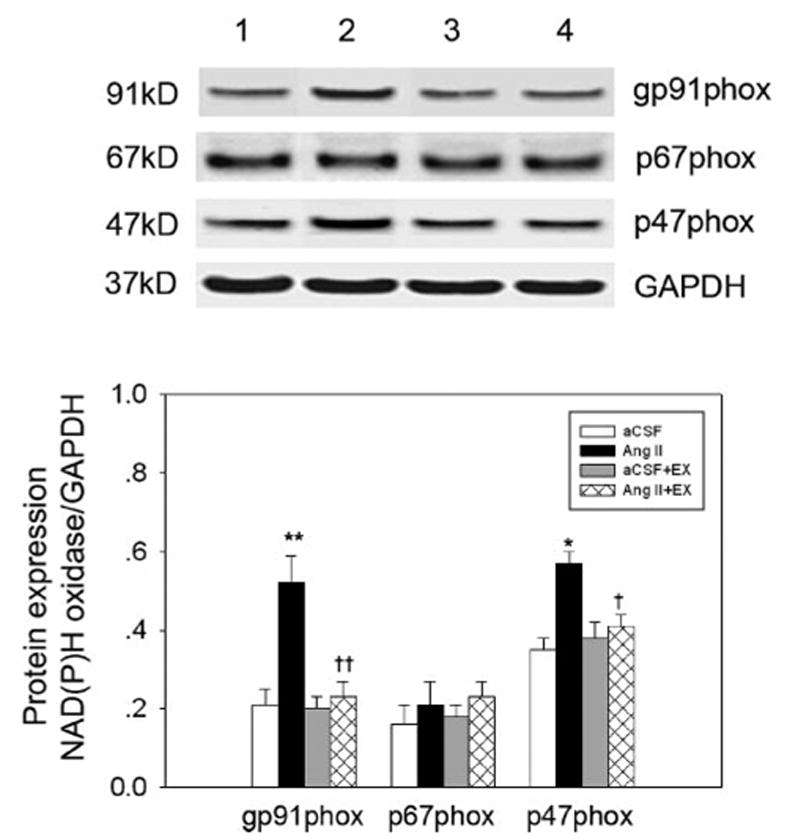
Figure 6.

The influence of EX on protein expression of NAD(P)H oxidase subunits in the PVN in the 4 groups of rats studied. Top, Representative Western blot for NAD(P)H subunit expression (lanes 1 to 4 are aCSF, Ang II, aCSF + EX, and Ang II + EX, respectively). Bottom, Mean data from densitometric analysis. Values are mean ± SE. *P < 0.05, **P < 0.01 vs aCSF; †P < 0.05, †† P < 0.01 vs Ang II. n = 6 in each group.
