
Figure 2.
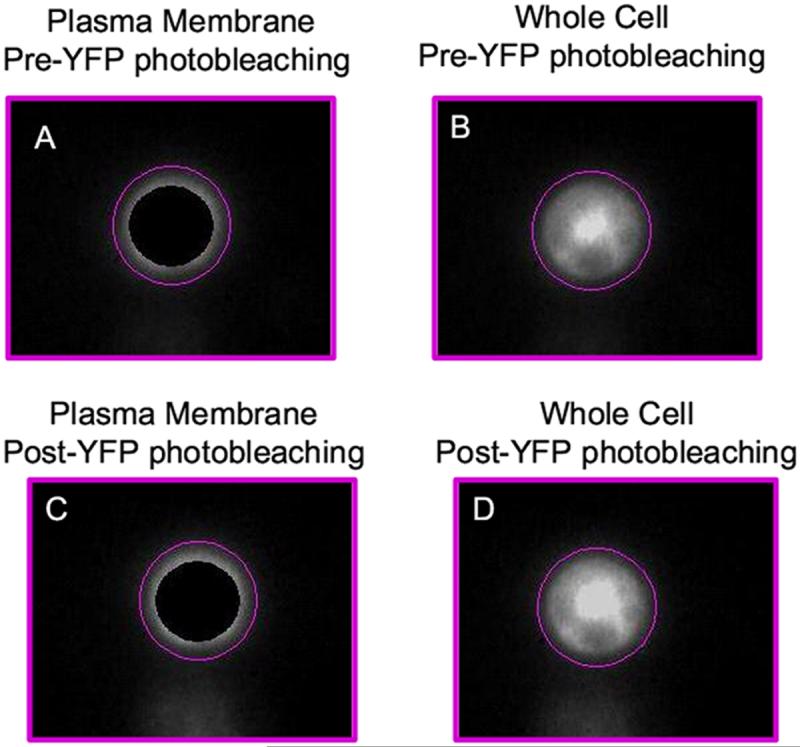
A comparison of FRET efficiencies from a whole cell and from a portion of the plasma membrane. Two methods were used to evaluate the extent of energy transfer efficiency. Panels A and C show donor fluorescence from periphery of the cell before and after acceptor photobleaching. Panels B and D show donor fluorescence from entire cell before and after acceptor photobleaching. In this example, the values for energy transfer efficiency (%E) were 12.7% and 12.9%, respectively.