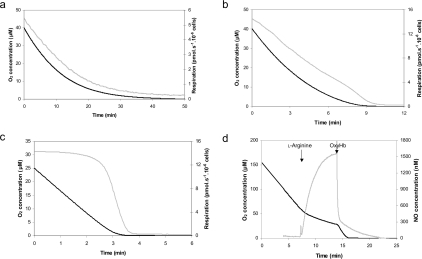
Figure 5. Inhibition of respiration induced by endogenous NO.
Online recording of O2 concentration (black line) and O2 flux (grey line) determined by high-resolution respirometry in cells pre-treated overnight with (a) 50, (b) 20 or (c) 2 ng/ml tetracycline and then stimulated by addition of L-arginine (1 mM) at an O2 concentration of 60 μM (a, b) or 30 μM (c). The low range of O2 concentrations [≤40 μM (a, b) and ≤25 μM (c)] and the corresponding O2 flux are shown as a function of time. (d) Online simultaneous recording of O2 concentration (black line) and NO gas production (grey line) in cells treated with tetracycline (1000 ng/ml). NO production started right after L-arginine addition (1 mM) and immediately inhibited respiration. Addition of oxyHb quenched NO and restored the control respiration rate. The results presented in each panel are representative of results obtained in at least three separate experiments.

