
Fig. 3.
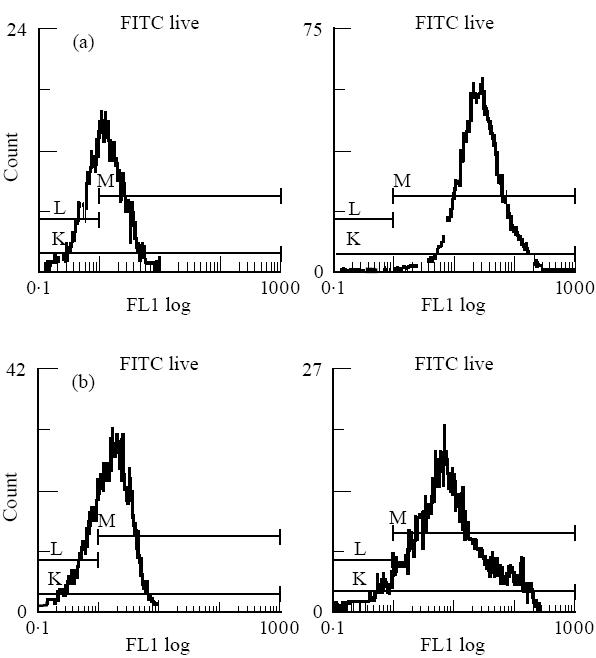
FACS histograms demonstrating binding of peptide A to DQ2-expressing transfectants and the HLA-negative DAP-3 parent line control. (a) DQ2 transfectants with protein A at 0 μmol/l (left, mean fluorescence 1.28) and 250 μmol/l (right, mean fluorescence 23.4). (b) DAP-3 control with protein A at 0 μmol/l (left, mean fluorescence 1.50) and 250 μmol/l (right, mean fluorescence 8.07).