
Fig. 4.
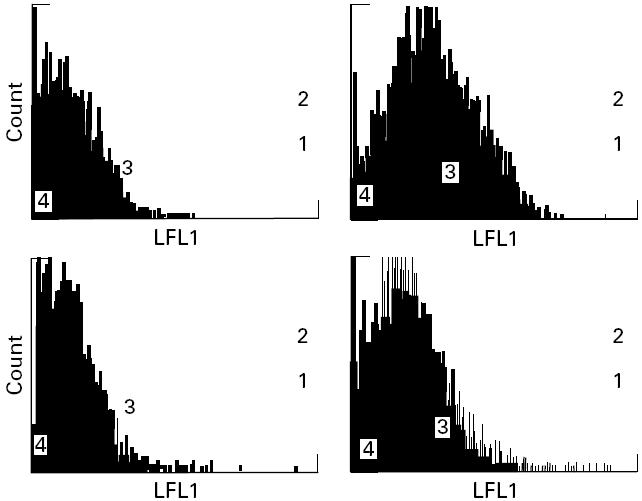
Binding of peptide A to B cells homozygous for HLA-DR3, -DQ2 and HLA-negative K562 controls by FACS analysis (see Materials and Methods). Top: B cells with protein A at 0 μmol/l (left, mean fluorescence 1.507) and 250 μmol/l (right, mean fluorescence 6.034). Bottom: K562 cells with protein A at 0 μmol/l (left, mean fluorescence 1.462) and 250 μmol/l (right, mean fluorescence 2.889).