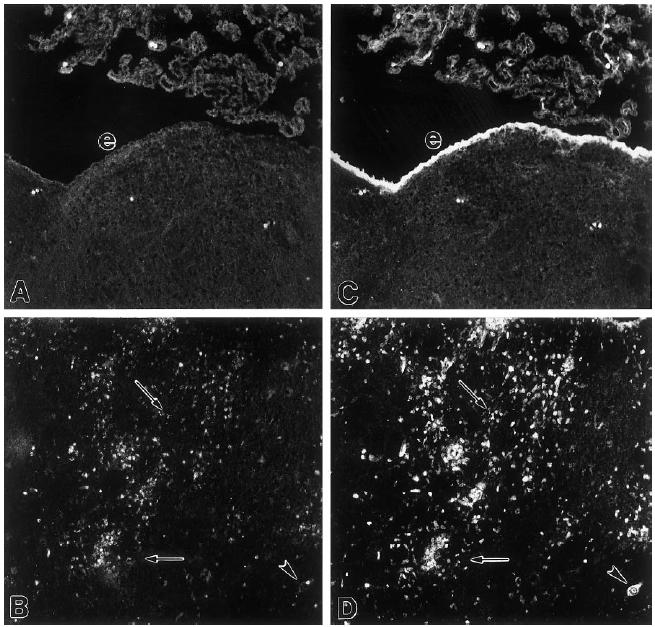
Fig. 1.

Microphotograph of a double-staining of ED1 (A,B) and annexin-1 (C,D) immunoreactivity in brains of rats with EAE. (A,C) Coronal section through the medulla oblongata 5 days after the induction of EAE. (B,D) Coronal section through the diencephalon 12 days after induction of EAE. e, Ependymal cells; arrowhead, neurone; arrows point at examples of annexin-1-positive cells that are not ED1+. Note that most ED1+ cells exhibit annexin-1 immunoreactivity. Mag. × 100.
