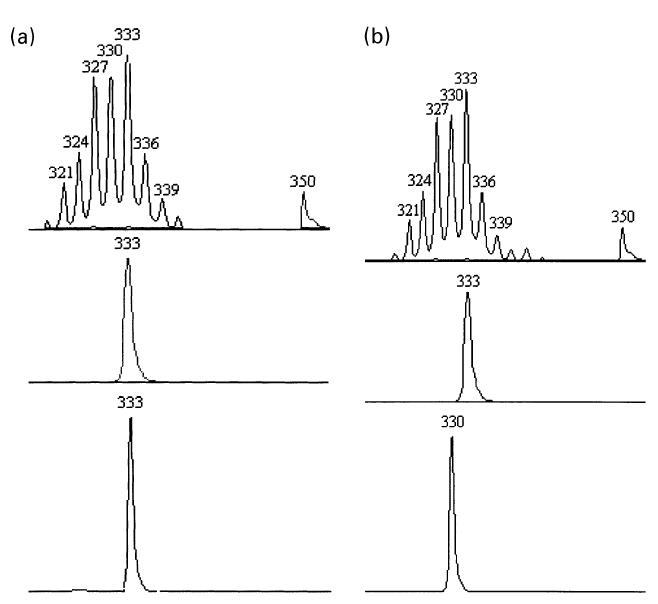
Fig. 3.

(a) Spectratyping analysis of Sa7 (bottom), SaH10 (centre) and peripheral blood mononuclear cell (PBMC) (top) Vβ13 T cell receptor (TCR) transcripts. One peak corresponding to a unique rearrangement migrates at the same expected size both for Sa7 and SaH10. Spectratyping of Vβ13 transcript from PBMC of the same patient is polyclonal, as shown by the bell-shape distribution of peaks in the top part of the figure. (b) Analysis of TaB9 (bottom), Ta91 (centre) and PBMC (top) Vβ13 TCR transcripts. One peak corresponding to a unique but diverse rearrangement migrates at slightly different sizes for Ta91 and TaB9. Spectratyping of Vβ13 transcript from PBMC of the same patient is polyclonal. The graph represents the intensity of fluorescence in arbitrary units as a function of polymerase chain reaction (PCR) product size in nucleotides and all the CDR3 peaks are 3 bp apart, suggestive of in-frame rearrangements.
