
Fig. 3.
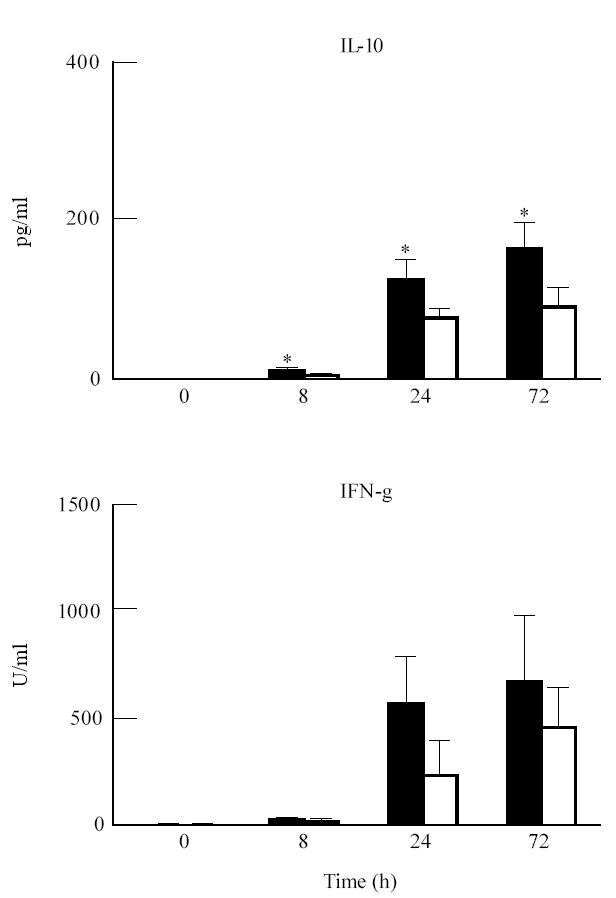
Comparison of IL-10 and IFN-γ production in whole blood (WB) cultures from IgA nephropathy (IgAN) patients (▪) and controls (□). WB (diluted 1:5) was cultured in triplicate in the absence or presence of lipopolysaccharide (LPS; 10 μg/ml). Production was determined in the culture supernatants, harvested after 0, 8, 24 and 72 h, by cytokine-specific ELISAs. Results represent geometric means ± s.e.m. *Significant differences (Scheffe's procedure) between patients and controls.