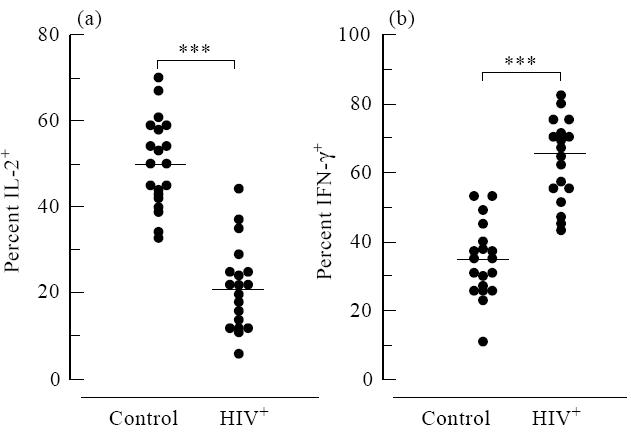
Fig. 2.

Stimulated T cells from HIV-infected individuals exhibit decreased intracellular staining for IL-2 (a) and increased IFN-γ staining (b) relative to control groups. The percentages of CD3+ T cells staining positive for IL-2 and IFN-γ were plotted for HIV+ and control groups (***P< 0.0001). Horizontal bars represent population means.
