
Fig. 3.
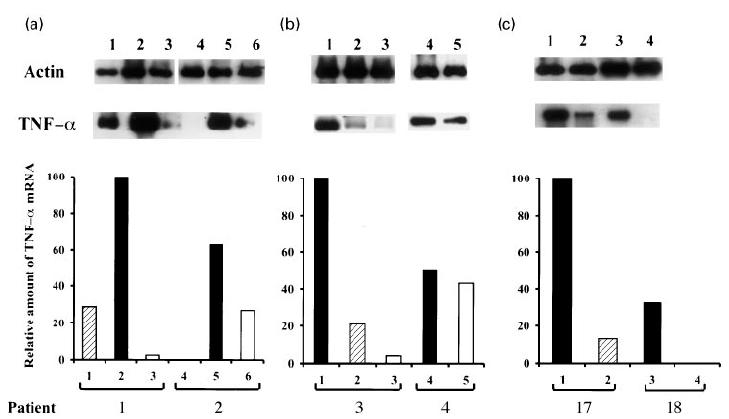
TNF-α mRNA expression in leprosy lesions evaluated by semiquantitative reverse transcriptase-polymerase chain reaction (RT-PCR). (a) Skin biopsies were taken from two patients before (lanes 1 and 4), at the onset of the reactional episode (ENL, lanes 2 and 5), and after 7 days of pentoxifilline (PTX) (lanes 3 and 6). mRNA from different samples was reverse transcribed and the cDNA derived from lesions was normalized to yield equivalent β-actin products. The relative amounts of TNF-α mRNA were compared among different samples from each individual patient and assessed as percentage of the most intense band for each experiment. (b) Biopsies were taken from two other patients at the onset of the ENL episode (lanes 1 and 4), and after 3 (lane 2) or 7 (lanes 3 and 5) days of PTX treatment. Biopsy samples were processed as described above for RT-PCR and semiquantitative analysis. (c) TNF-α mRNA expression during thalidomide treatment evaluated by semiquantitative RT-PCR as described. Skin biopsies were taken from two patients at the onset of the reactional episode (ENL, lanes 1 and 3), and following 3 (lane 2) or 7 (lane 4) days of treatment with thalidomide.