
Fig. 4.
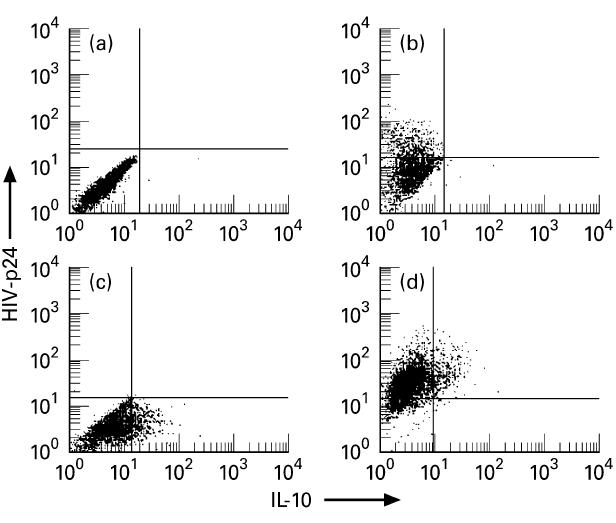
Cytofluorimetric assessment of individual IL-10- and HIV-p24 antigen-producing cells in lipopolysaccharide (LPS)-stimulated macrophages by specific two-colour, intracellular staining. (a,b) Uninfected and HIV-Ba-L-infected macrophages cultured in the absence of macrophage colony-stimulating factor (M-CSF). (c,d) Uninfected and HIV-Bal-infected macrophages cultured in the presence of M-CSF. The data are displayed as bivariate dot plots. The quadrants were set according to the negative controls (< 1% of the isotype control cells appeared positive). Low left quadrants, unstained cells; upper left quadrants, HIV-p24-stained cells; low right quadrants, IL-10-stained cells; upper right quadrants, cells stained for both IL-10 and HIV-p24. Five thousand to 10 000 cells were analysed for each sample. The data refer to a typical experiment of three performed with similar results.