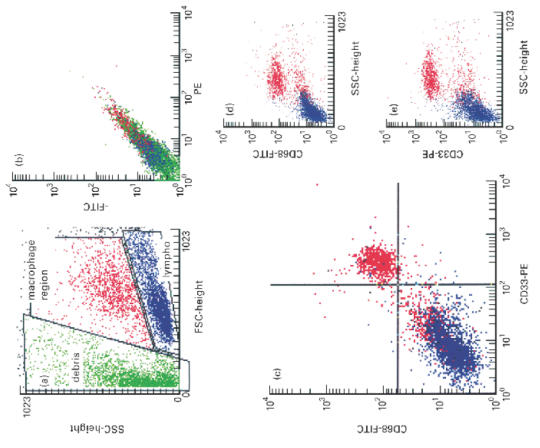
Fig. 3.

FACS analysis of the co-expression of CD68 and CD33. (a) Forward/side scatter plot of permeabilized colonic macrophages showing an increase in debris (green). Regions were set on the macrophage (red) and lymphocyte population (blue). (b) Isotype control showing no non-specific staining. (c) Co-expression of CD68 and CD33 (upper right quadrant). The cells expressing both antigens have optical characteristics of macrophages. The red cells in the lower left quadrant indicate, again, that optical characteristics are not sufficient to distinguish clearly between colonic lymphocytes and macrophages. There are almost no cells expressing either CD33 (lower right quadrant) or CD68 (upper left quadrant) alone. (d) Side scatter versus CD68 plot showing clearly a positive cell population. (e) Side scatter versus CD33 plot showing a positive population with very similar side scatter characteristics compared with the CD68+ cells.
