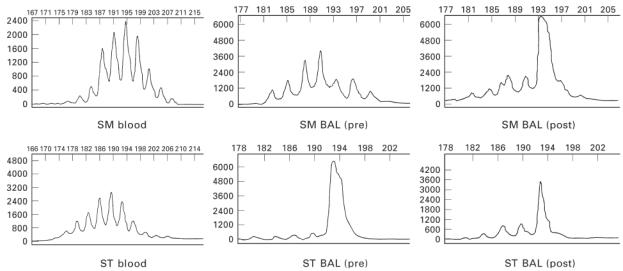
Fig. 5.

Electrophoretic profiles derived from automated gene scanning of cDNA polymerase chain reaction (PCR) products from peripheral blood and bronchoalveolar lavage (BAL) of asthmatic subjects. Relative fluorescence intensities (ordinate) are plotted as a function of PCR fragment size (abscissa). Top row: BV5S2/3 scan profiles for patient SM showing a normal Gaussian distribution of PCR products for blood and BAL (before challenge) and a clonal scan profile (one dominant fluorescent peak) for BAL (post-challenge). Bottom row: BV5S2/3 scan profiles for patient ST showing a normal Gaussian distribution of PCR products for blood and a clonal scan profile for BAL both pre- and post-allergen challenge.
