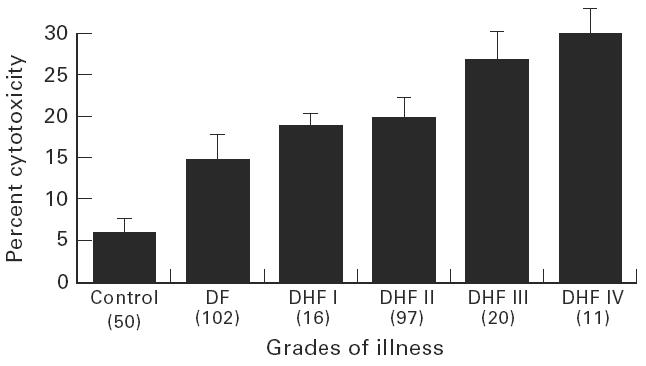
Fig. 3.

Mean cytotoxic activity in the culture supernatants from controls and cases of various grades of illness. The bars over the column represent the size of the s.d. and the figures in parentheses represent total number of patients in each group.
