
Fig. 1.
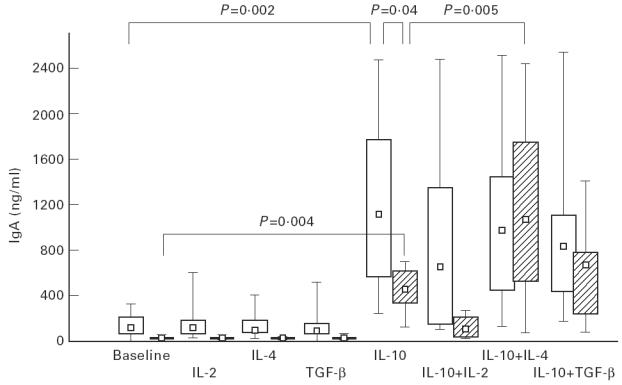
In vitro IgA production by peripheral blood mononuclear cells (PBMC) from IgAD patients (hatched bars) and controls (open bars) at baseline and after stimulation with interleukins. Box plots indicate range (whiskers), 25% and 75% interval (box) and median value (small square). For statistical analyses see text.