
Fig. 1.
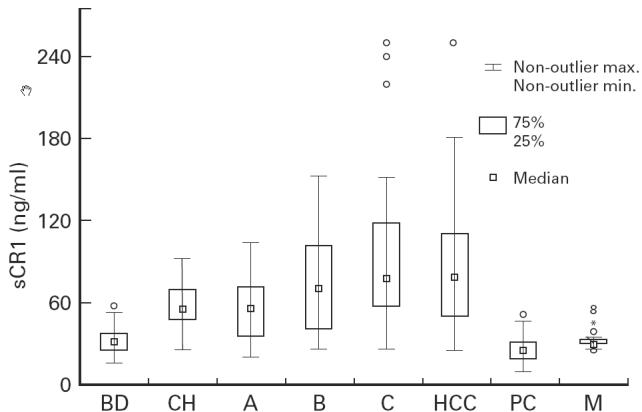
sCR1 serum levels in patients with liver diseases at different stages and in controls. Box and whisker plot (type: median/quart/range). Internal rectangle, median; external rectangle, interquartile range; whiskers, range; open circles, outliers. BD, Blood donors; CH, chronic hepatitis; A,B,C, Child–Pugh classes of liver cirrhosis; HCC, hepatocellular carcinoma; PC, pancreatic carcinoma; M, other malignancies: breast (n = 15) and lung (n = 8) cancer.