
Fig. 5.
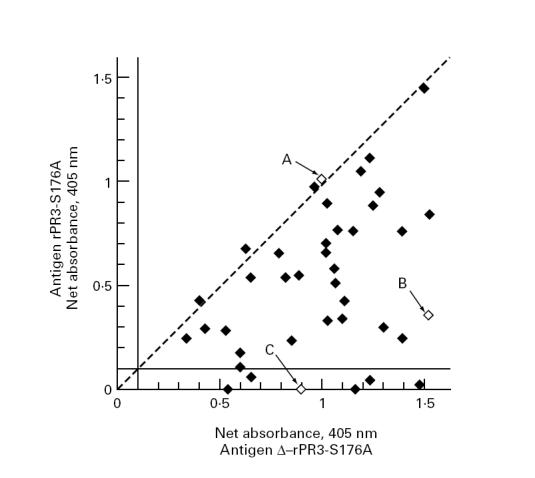
Scattergram of absorbance values obtained by capture ELISA with the two different rPR3 substrates. Forty consecutive PR3-ANCA+ serum samples were evaluated by capture ELISA using culture supernatants either from rPR3-S176A-expressing 293 cells (ordinate) or from δ-rPR3-S176A-expressing 293 cells (abscissa) as target antigen. Net absorbance values of < 0.100 are considered negative in this assay. The dashed diagonal reference line indicates equal reactivity with both target antigens. The majority of samples contained some antibodies that reacted with epitopes that only became accessible on the PR3 molecule after cleavage of the N-terminal activation dipeptide. The three serum samples marked by arrows A, B, and C are the ones for which the dilution curves are shown in Fig. 6.