
Fig. 6.
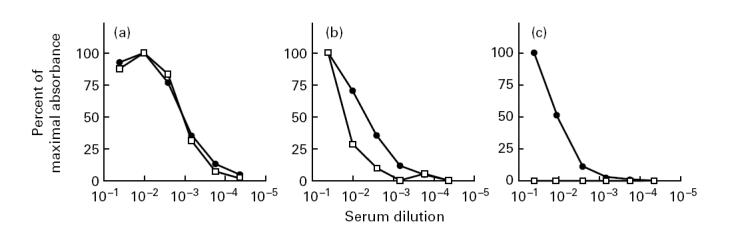
Dilution curves of three representative PR3-ANCA-containing sera. Shown are the dilution curves of the three sera indicated in Fig. 5 as A, B, and C, representing examples of three types of sera: (a) yielding equivalent absorbance values with both target antigens; (b) yielding positive, but substantially different absorbance values with the two target antigens; (c) showing no reactivity with the unprocessed proform of rPR3-S176A. The data are expressed as percentage of maximal absorbance obtained with a serum dilution of 1:20. •, Reactivity of the serum samples with δ-rPR3-S176A; □, reactivity with rPR3-S176A.