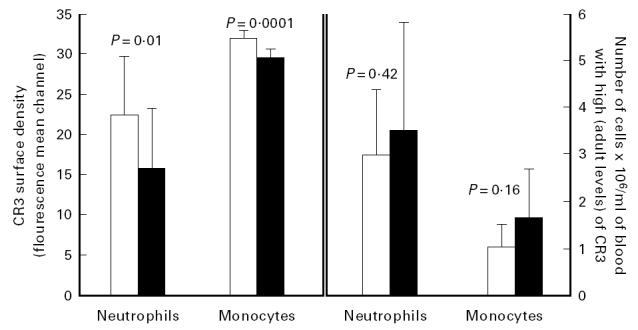
Fig. 3.

Comparison of adult (□) and neonatal (▪) leucocytes for CR3 density and for the concentration of cells with high CR3. The histogram on the left indicates the CR3 surface density of the entire populations of adult and neonatal leucocytes. The histogram on the right shows adult or cord blood concentrations of neutrophils and monocytes containing high densities (adult levels) of CR3. The mean leucocyte counts for 15 cord versus 12 adult blood samples were 10.8 ± 4.0 versus 5.5 ± 1.6 × 10⁶ per ml, and differential counts for the cord versus adult blood samples were 3.9 ± 1.1 versus 2.6 ± 1.0 × 10⁶ per ml for neutrophils and 3.3 ± 1.9 versus 1.1 ± 0.48 × 10⁶ per ml monocytes.
