
Fig. 4.
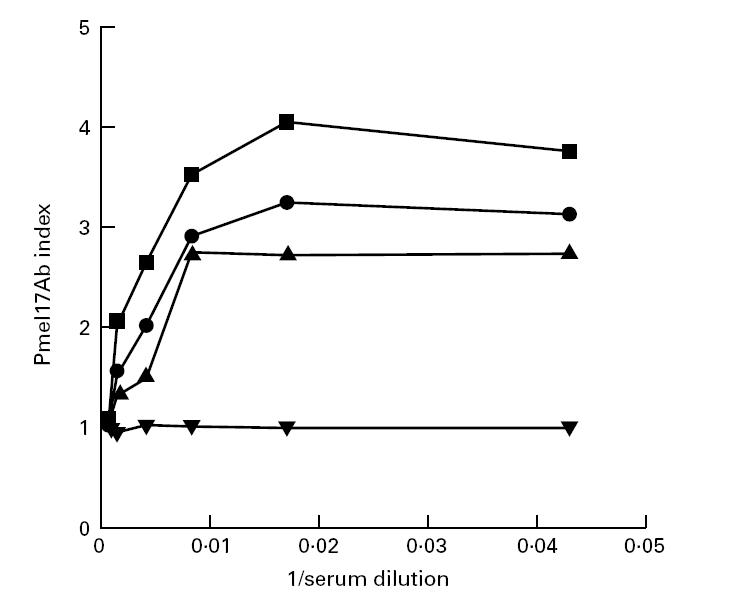
Dilution curves of Pmel17 antibody-positive sera and one healthy control serum. The Pmel17Ab index of each positive serum and one healthy control serum at each dilution is plotted as a function of 1/serum dilution. Each Pmel17Ab index is the mean Pmel17Ab index of three experiments with a s.d. within 15%. ▪, Pmel17 antibody-positive serum 1; •, Pmel17 antibody-positive serum 2; ▴, Pmel17 antibody-positive serum 3; ▾, healthy control serum.